EdTech
Scaling Data Analytics for a Growing EdTech Platform
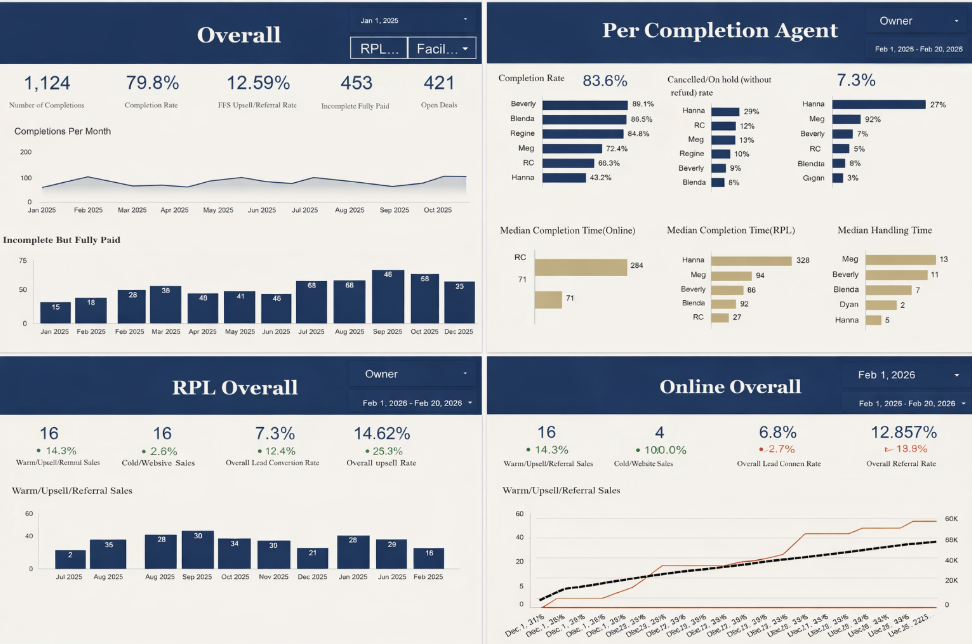
How we built a centralized data warehouse and automated reporting infrastructure to drive 83.6% completion rates and real-time decision making.
Real-time Insights
Automated Pipelines
Funnel Optimization
Impact at a Glance
83.6%
Completion Rate
1,124
Total Completions
100%
Automated Reporting
The Challenge
When we first engaged with Get My Course, they were experiencing rapid growth in enrollments, marketing campaigns, and partner collaborations. While growth was positive, their data ecosystem was becoming increasingly complex and difficult to manage.
- Fragmented Marketing & Sales Data: Data from Facebook Ads, Google Ads, organic channels, CRM systems, and payment gateways existed in separate platforms.
- Manual Reporting & Delayed Insights: The team relied heavily on manual exports and spreadsheet consolidation. Weekly performance reports required hours of effort.
- Limited Funnel Visibility: There was no clear end-to-end tracking of the student journey — from ad click to lead generation, counseling calls, enrollment, and final payment.
- Scaling Challenges: As marketing budgets increased, leadership needed granular insights into campaign efficiency and counselor performance.
The Solution
Our objective was to build a centralized, scalable, and automated analytics infrastructure that could provide real-time, reliable, and actionable insights across the entire business funnel.
Single Source of Truth
Designed a cloud-based data architecture using Google BigQuery as the centralized data warehouse, integrating all marketing, CRM, and sales data.
Automated Pipelines
Implemented automated ETL processes to extract and load data from multiple sources on scheduled intervals, removing manual dependency.
Executive Dashboards
Developed comprehensive Looker Studio dashboards covering Marketing Performance, Sales Funnel, Counselor Metrics, and Revenue Trends.
Funnel Transparency
Mapped the entire user journey from first ad interaction to final enrollment, enabling accurate attribution and drop-off identification.
Growth Trajectory
Completions Per Month
Consistent growth in course completions following the implementation of data-driven optimization.
Business Impact
Real-Time Decision Making: Reporting cycles shifted from manual weekly reports to near real-time.
Improved Marketing ROI: Optimized budgets toward high-performing channels significantly improved ROAS.
Stronger Sales Funnel: Conversion rates improved through targeted interventions.
Operational Efficiency: Eliminated manual reporting, freeing up team bandwidth.
Clear Revenue Visibility: Full transparency into course-wise and counselor-wise revenue.
Scalable Infrastructure: A robust foundation for future growth and advanced analytics.
Technical Implementation
Tech Stack
Google BigQuery
Looker Studio
SQL
Google Ads API
Facebook Ads API
Data Sources
- Facebook Ads
- Google Ads
- CRM System
- Payment Gateways
- Enrollment DB
Key Deliverables
- Centralized Data Warehouse
- Automated ETL Pipelines
- Executive Dashboards
- Funnel Attribution Models
- Role-Based Access Control